Performance Monitoring (OEE, KPIs)
Leverage real-time and historical production data to optimize equipment performance, reduce waste, and improve asset longevity. With complete operational visibility, you can drive smarter decisions, continuous improvement, and stronger profitability.
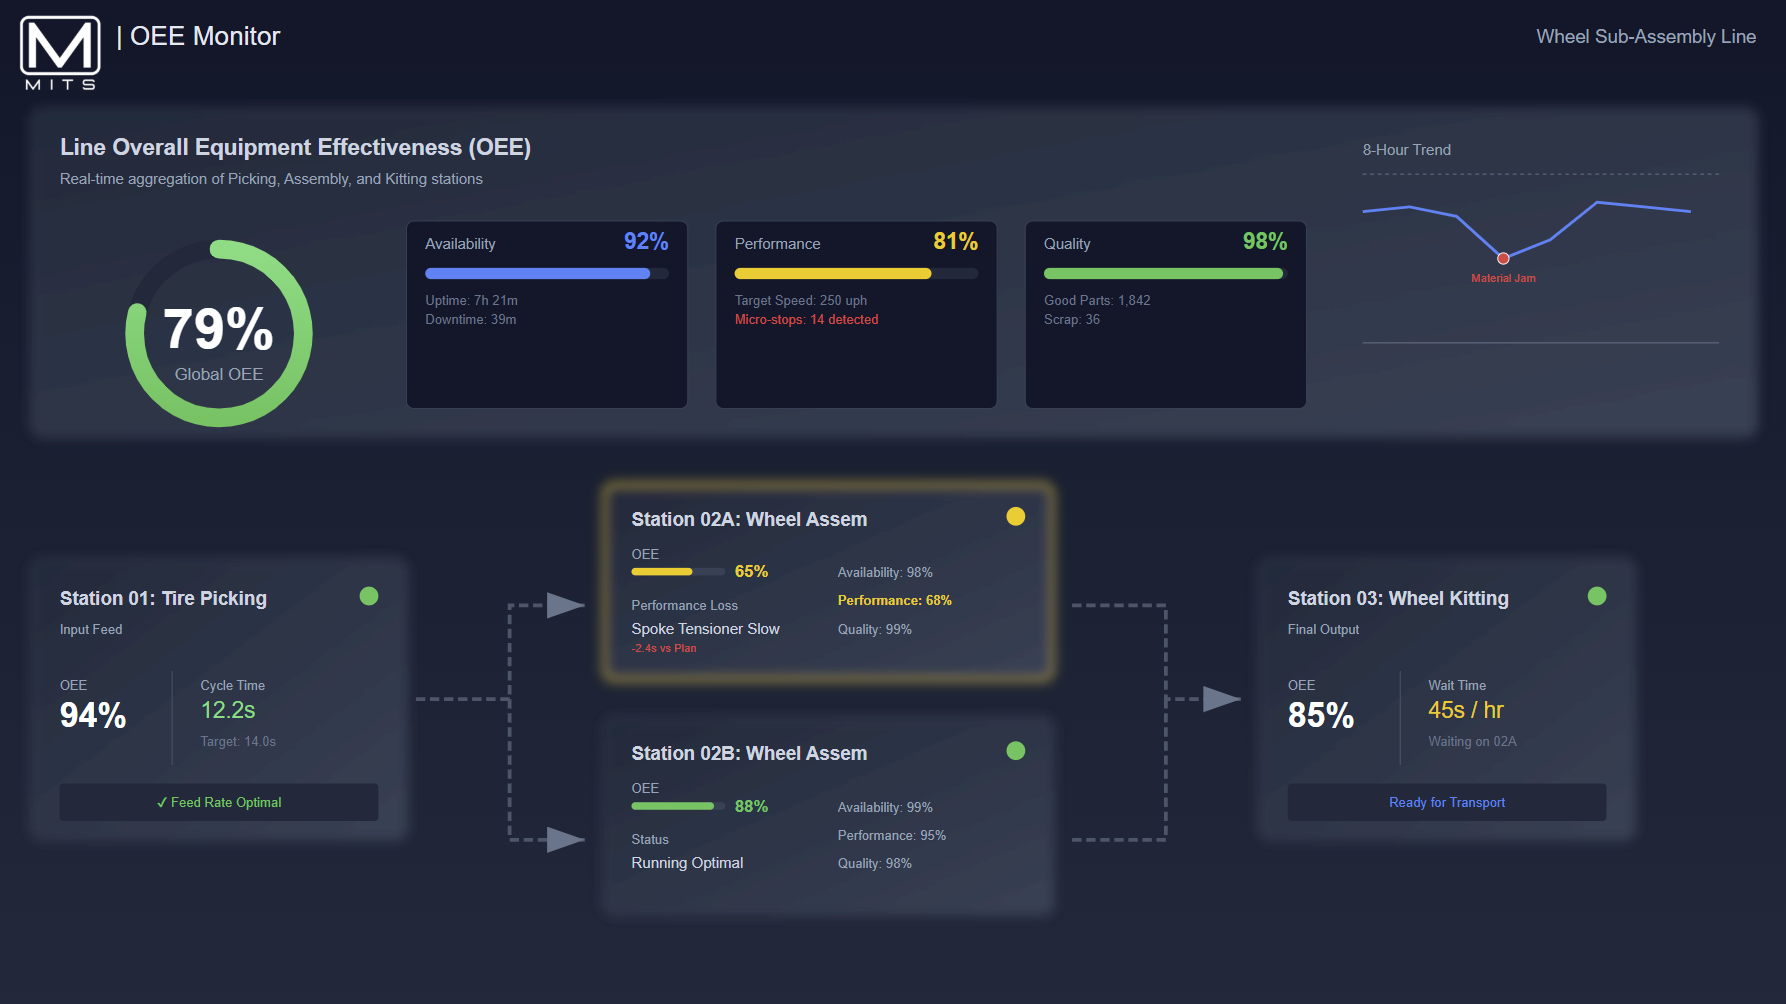
Overall Equipment Effectiveness (OEE)
Monitor Availability, Performance, and Quality in real time and historically to understand true equipment effectiveness. MITS automatically calculates OEE at the machine, line, or plant level, helping teams pinpoint the root causes of lost productivity and prioritize improvement efforts.
Real-time and historical OEE tracking
Auto-calculates at machine, line, plant levels
Pinpoints root causes of lost productivity
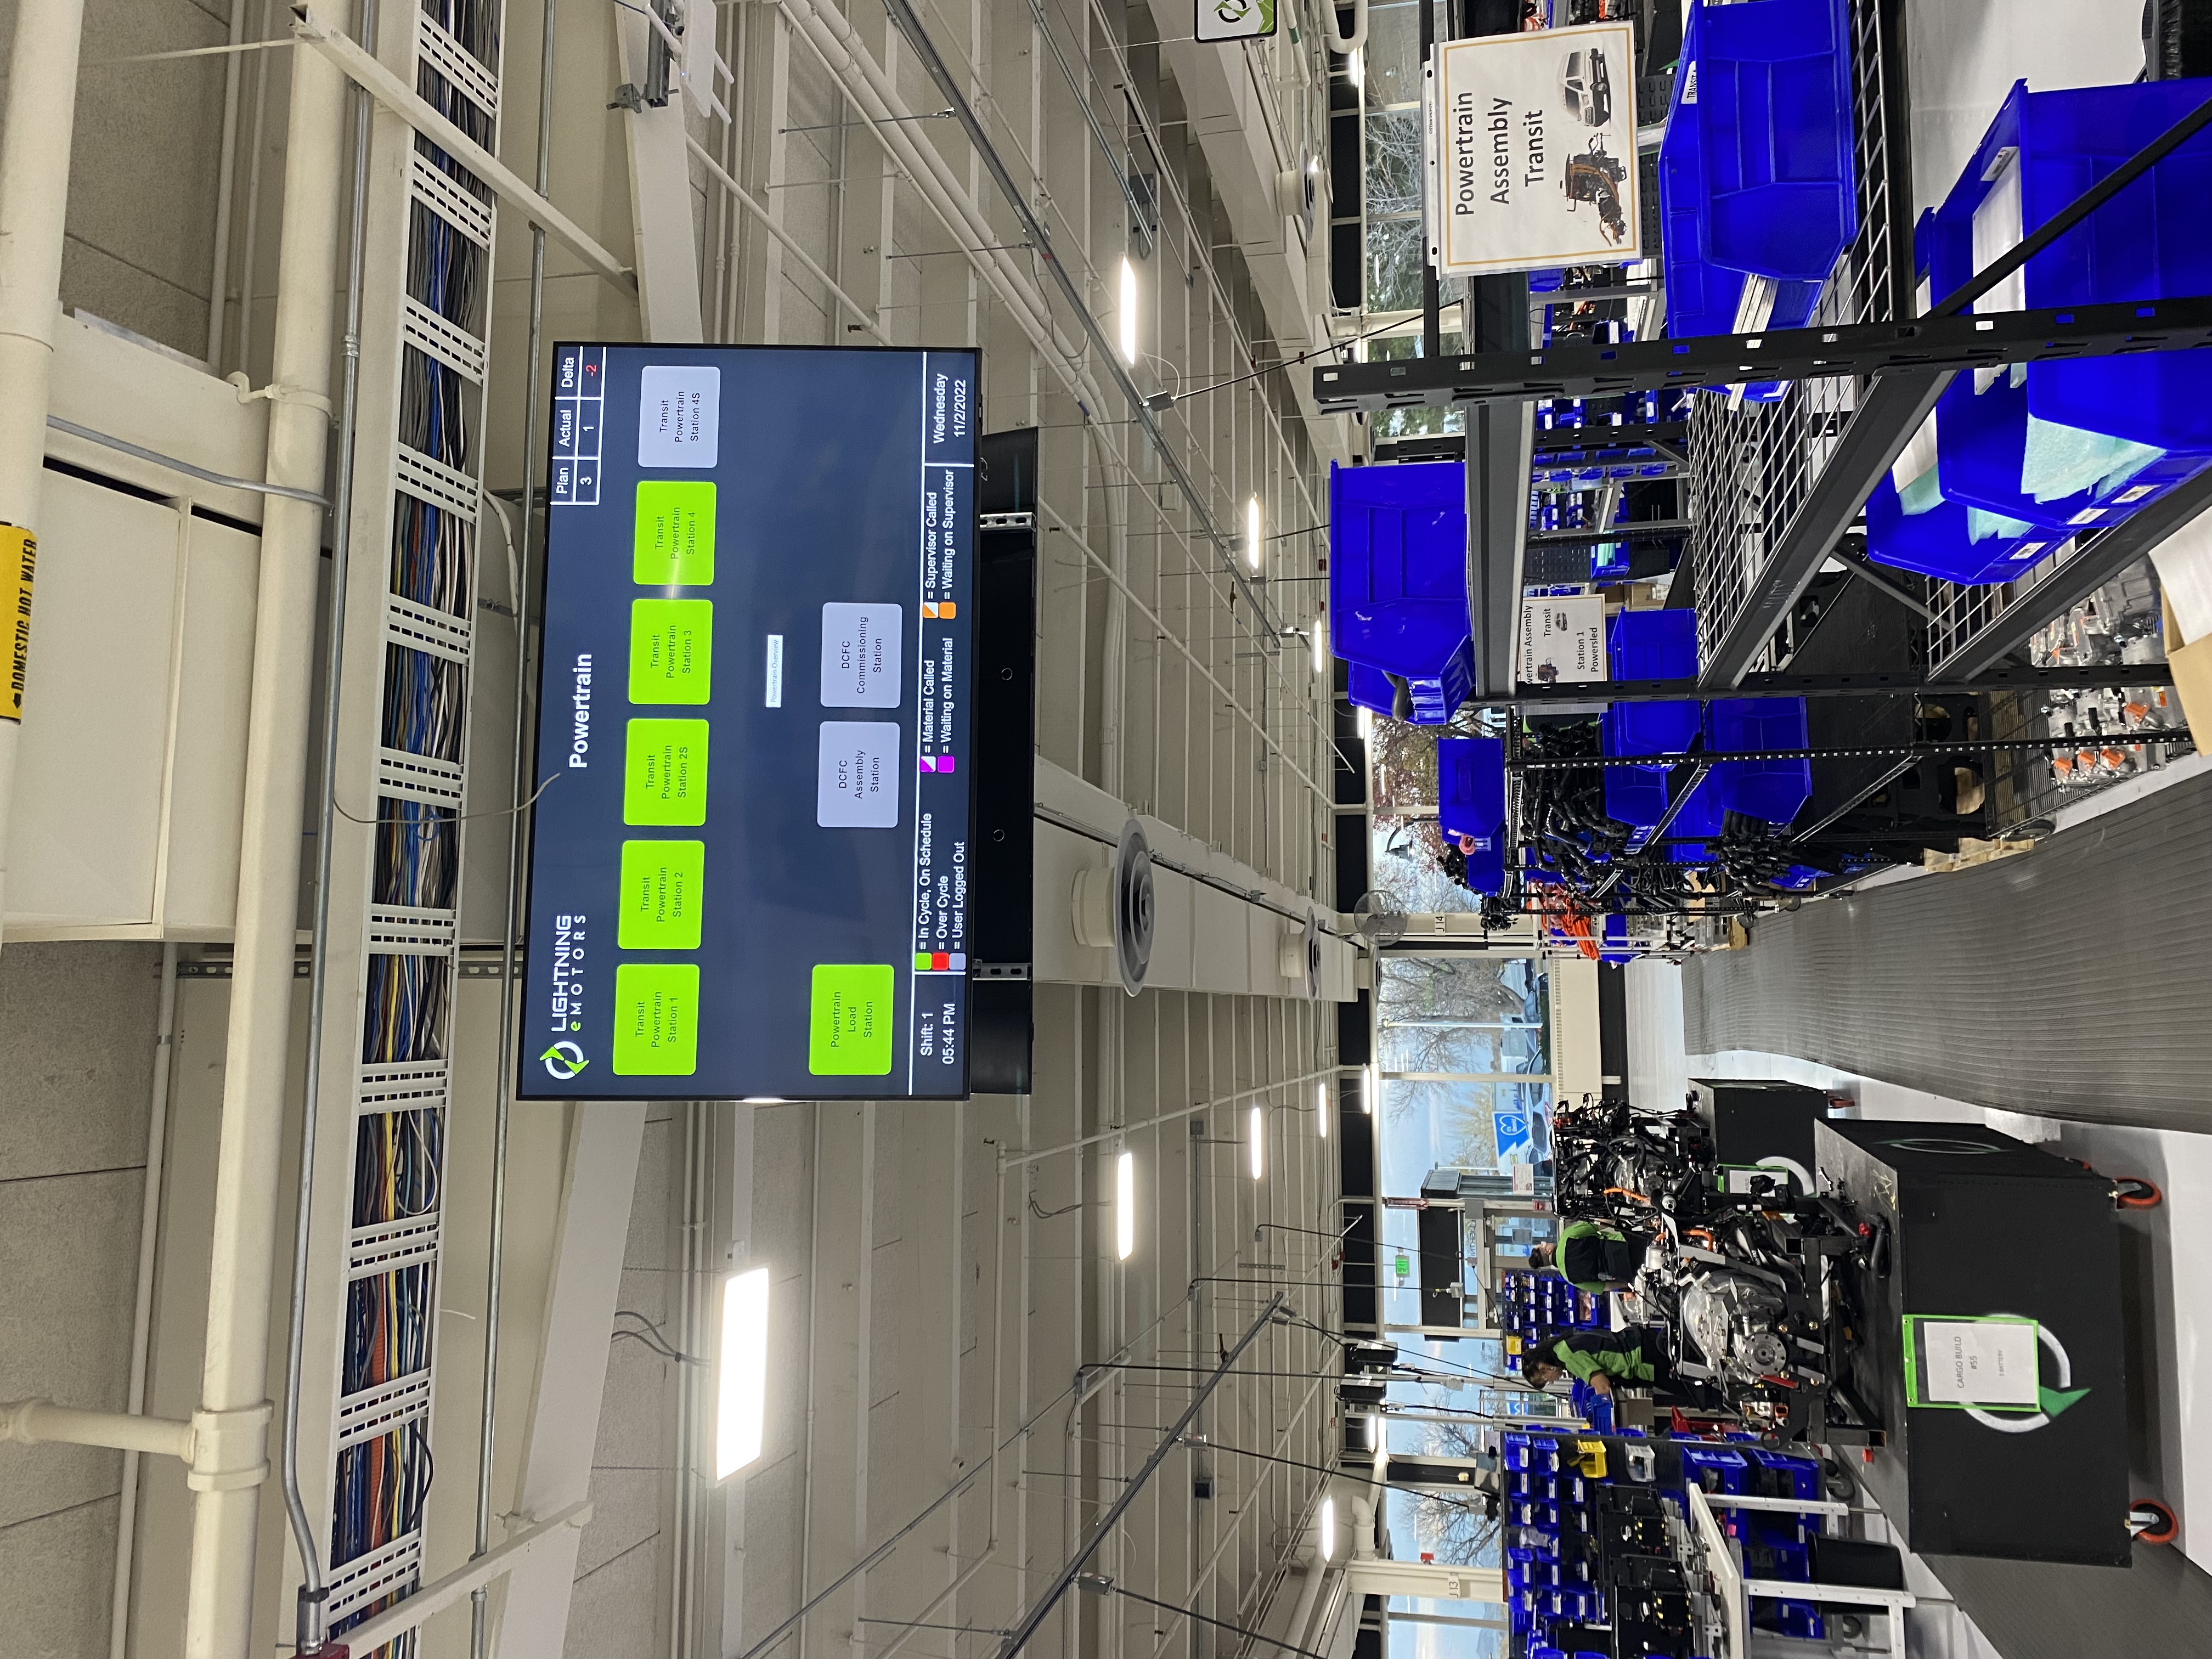
Real-Time Production Dashboards
Visualize live production status, KPIs, and alerts through configurable dashboards. Operators, supervisors, and management gain immediate insight into equipment performance, production rates, downtime events, and constraint areas, enabling faster response to issues on the shop floor.
Live KPIs and alerts visualization
Instant insight for all team levels
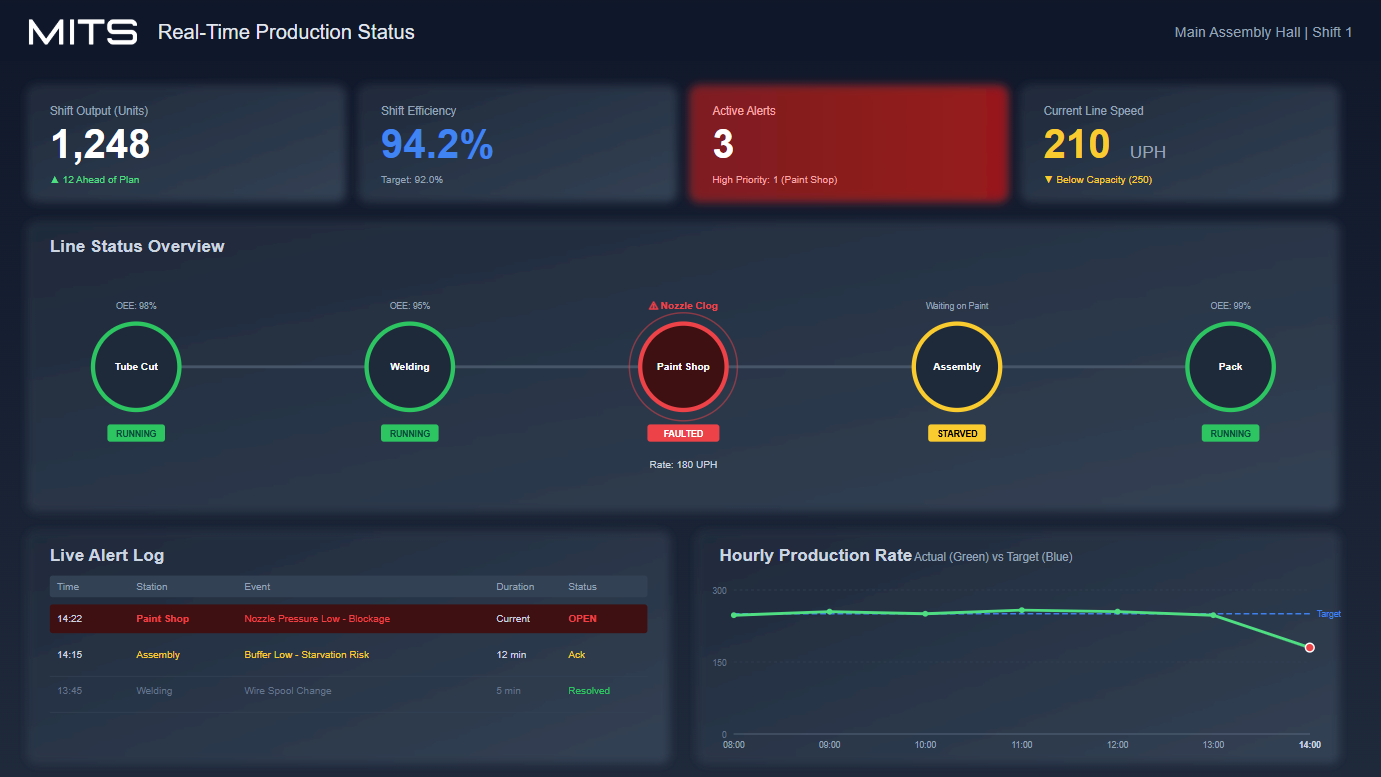
Downtime & Loss Analysis
Automatically capture and categorize downtime events, including planned stops, unplanned failures, and micro-stoppages. Detailed loss analysis reveals where time is being lost and why, supporting targeted corrective actions and data-backed maintenance strategies.
Auto-captures all downtime types
Categorizes planned vs. unplanned losses
Reveals true time loss drivers
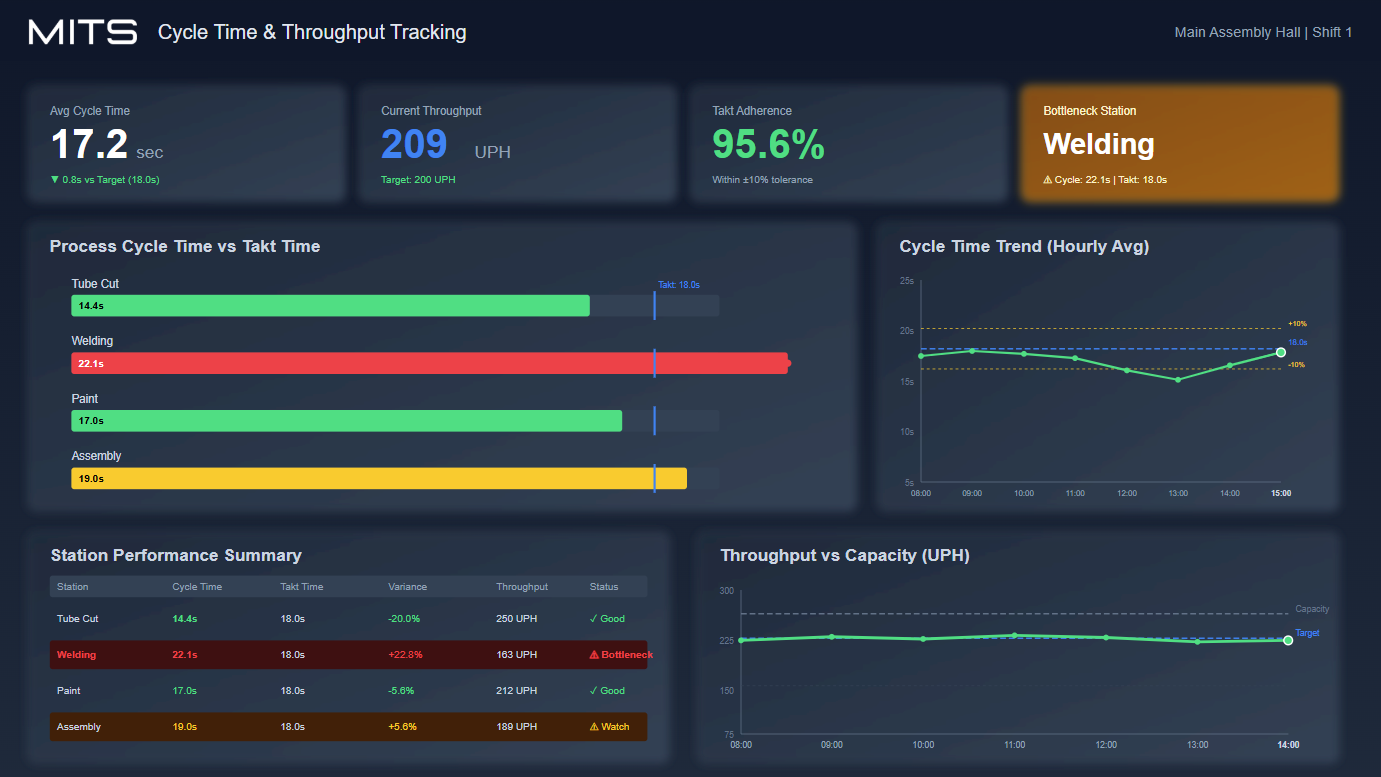
Cycle Time & Throughput Tracking
Track actual cycle times, throughput, and takt adherence across processes and equipment. Compare performance against targets to identify bottlenecks, process variation, and opportunities to improve flow and capacity utilization.
Tracks cycle times and throughput
Compares against takt time targets
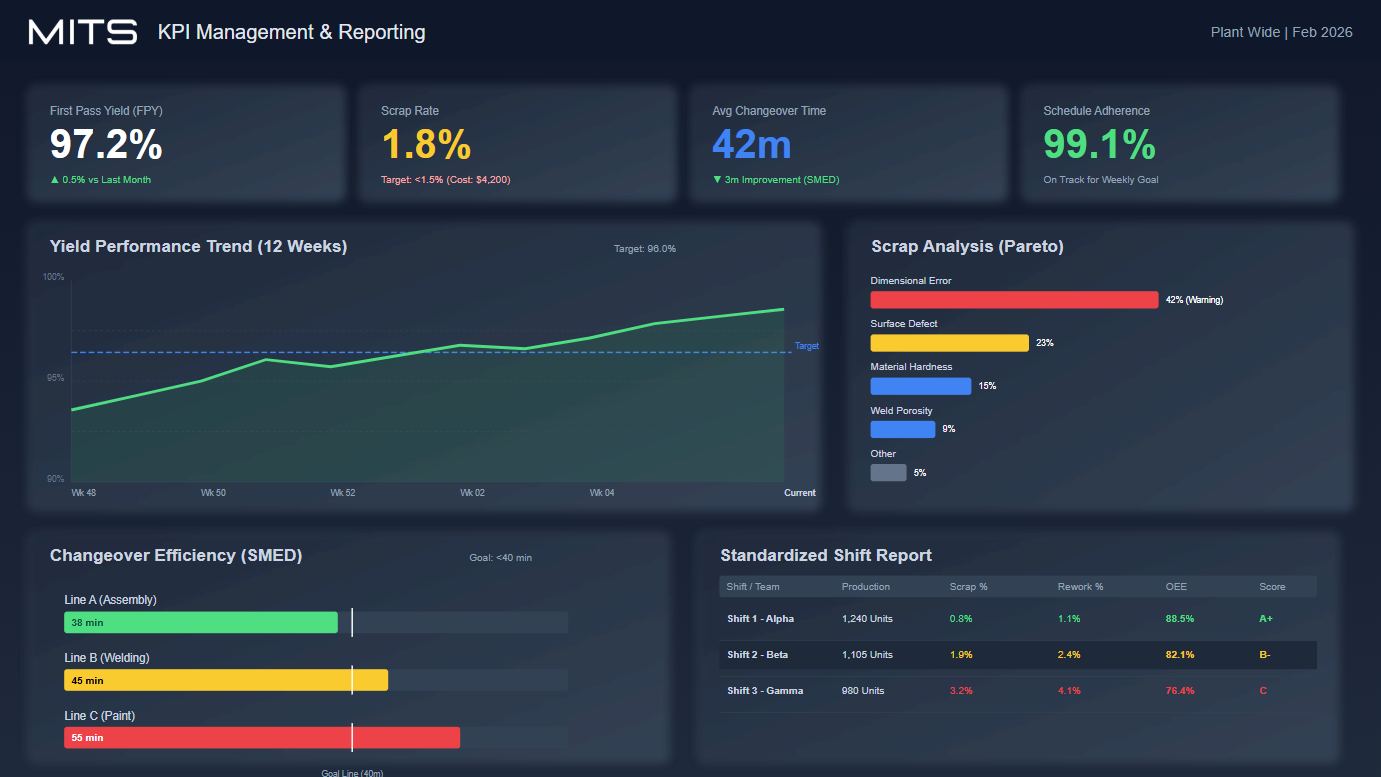
KPI Management & Reporting
Define, track, and standardize key performance indicators aligned with operational and business objectives. MITS provides automated reporting and trend analysis for KPIs such as yield, scrap, rework, changeover efficiency, and schedule adherence, ensuring consistent metrics across the organization.
Standardizes KPIs organization-wide
Automated trend reporting
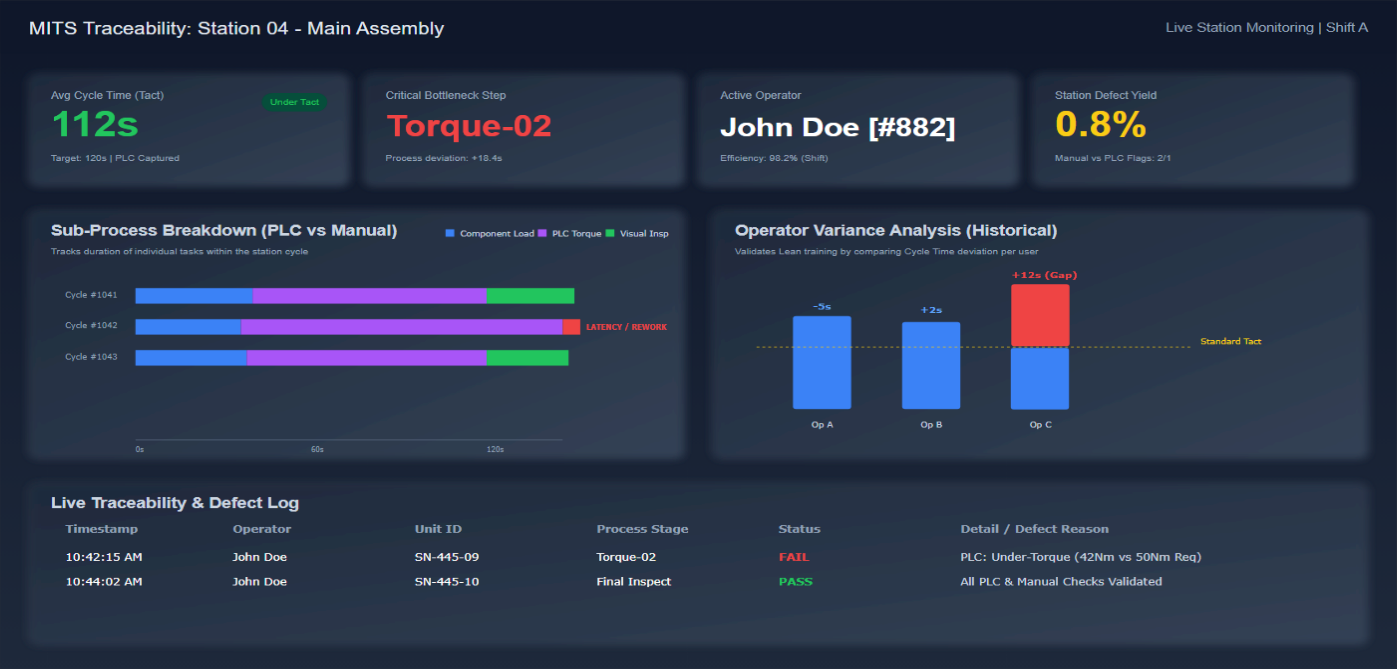
Historical Analysis & Continuous Improvement
Analyze long-term performance trends using historical data to support Lean, Six Sigma, and continuous improvement initiatives. MITS enables teams to validate improvement efforts, quantify gains, and sustain results over time.
Long-term trend analysis
Validates Lean and Six Sigma gains
Turn performance data into measurable results
Without accurate, timely performance data, inefficiencies remain hidden and improvement efforts rely on assumptions. MITS replaces guesswork with clear, objective insights into how your operations truly perform. By empowering teams with reliable OEE and KPI data, you gain the clarity needed to improve productivity, reduce downtime, and maximize the return on your manufacturing investments.
MITS captures real-time and historical performance data across machines, lines, and processes to expose true sources of loss. Availability losses, speed losses, quality losses, and micro-stoppages are automatically categorized, giving teams a clear, objective view of where time and capacity are being consumed.
MITS replaces manual data collection with automated, real-time dashboards and standardized KPIs. Operators, supervisors, and leadership see the same performance data as it happens, enabling faster decisions and eliminating delays caused by disconnected or lagging reports.
By correlating production performance with downtime events, quality data, equipment usage, labor, and process conditions, MITS enables deeper root cause analysis. Teams can move beyond symptoms to understand why performance varies by shift, product, equipment, or operating condition.
Real-time alerts and threshold-based notifications in MITS allow teams to intervene before small issues become missed shifts or lost production days. Supervisors gain early warning signals instead of learning about problems during end-of-shift or end-of-week reviews.
MITS provides long-term historical analysis to validate continuous improvement efforts. Before-and-after comparisons, trend analysis, and performance baselines allow teams to quantify gains, sustain improvements, and demonstrate ROI from Lean, Six Sigma, and operational excellence initiatives.